Line chart
Refreshed every hour
›Revenue per business unit, last 30 days, day-by-day.
Schedule the questions your team asks the most. Inquerio AI runs them, validates the answers, and turns each one into a chart. Compose the charts into a dashboard and embed it on any site you run.
Each panel was a sentence first. Click any chart, and the question behind it is one tap away, along with the source data and the last time it was refreshed.
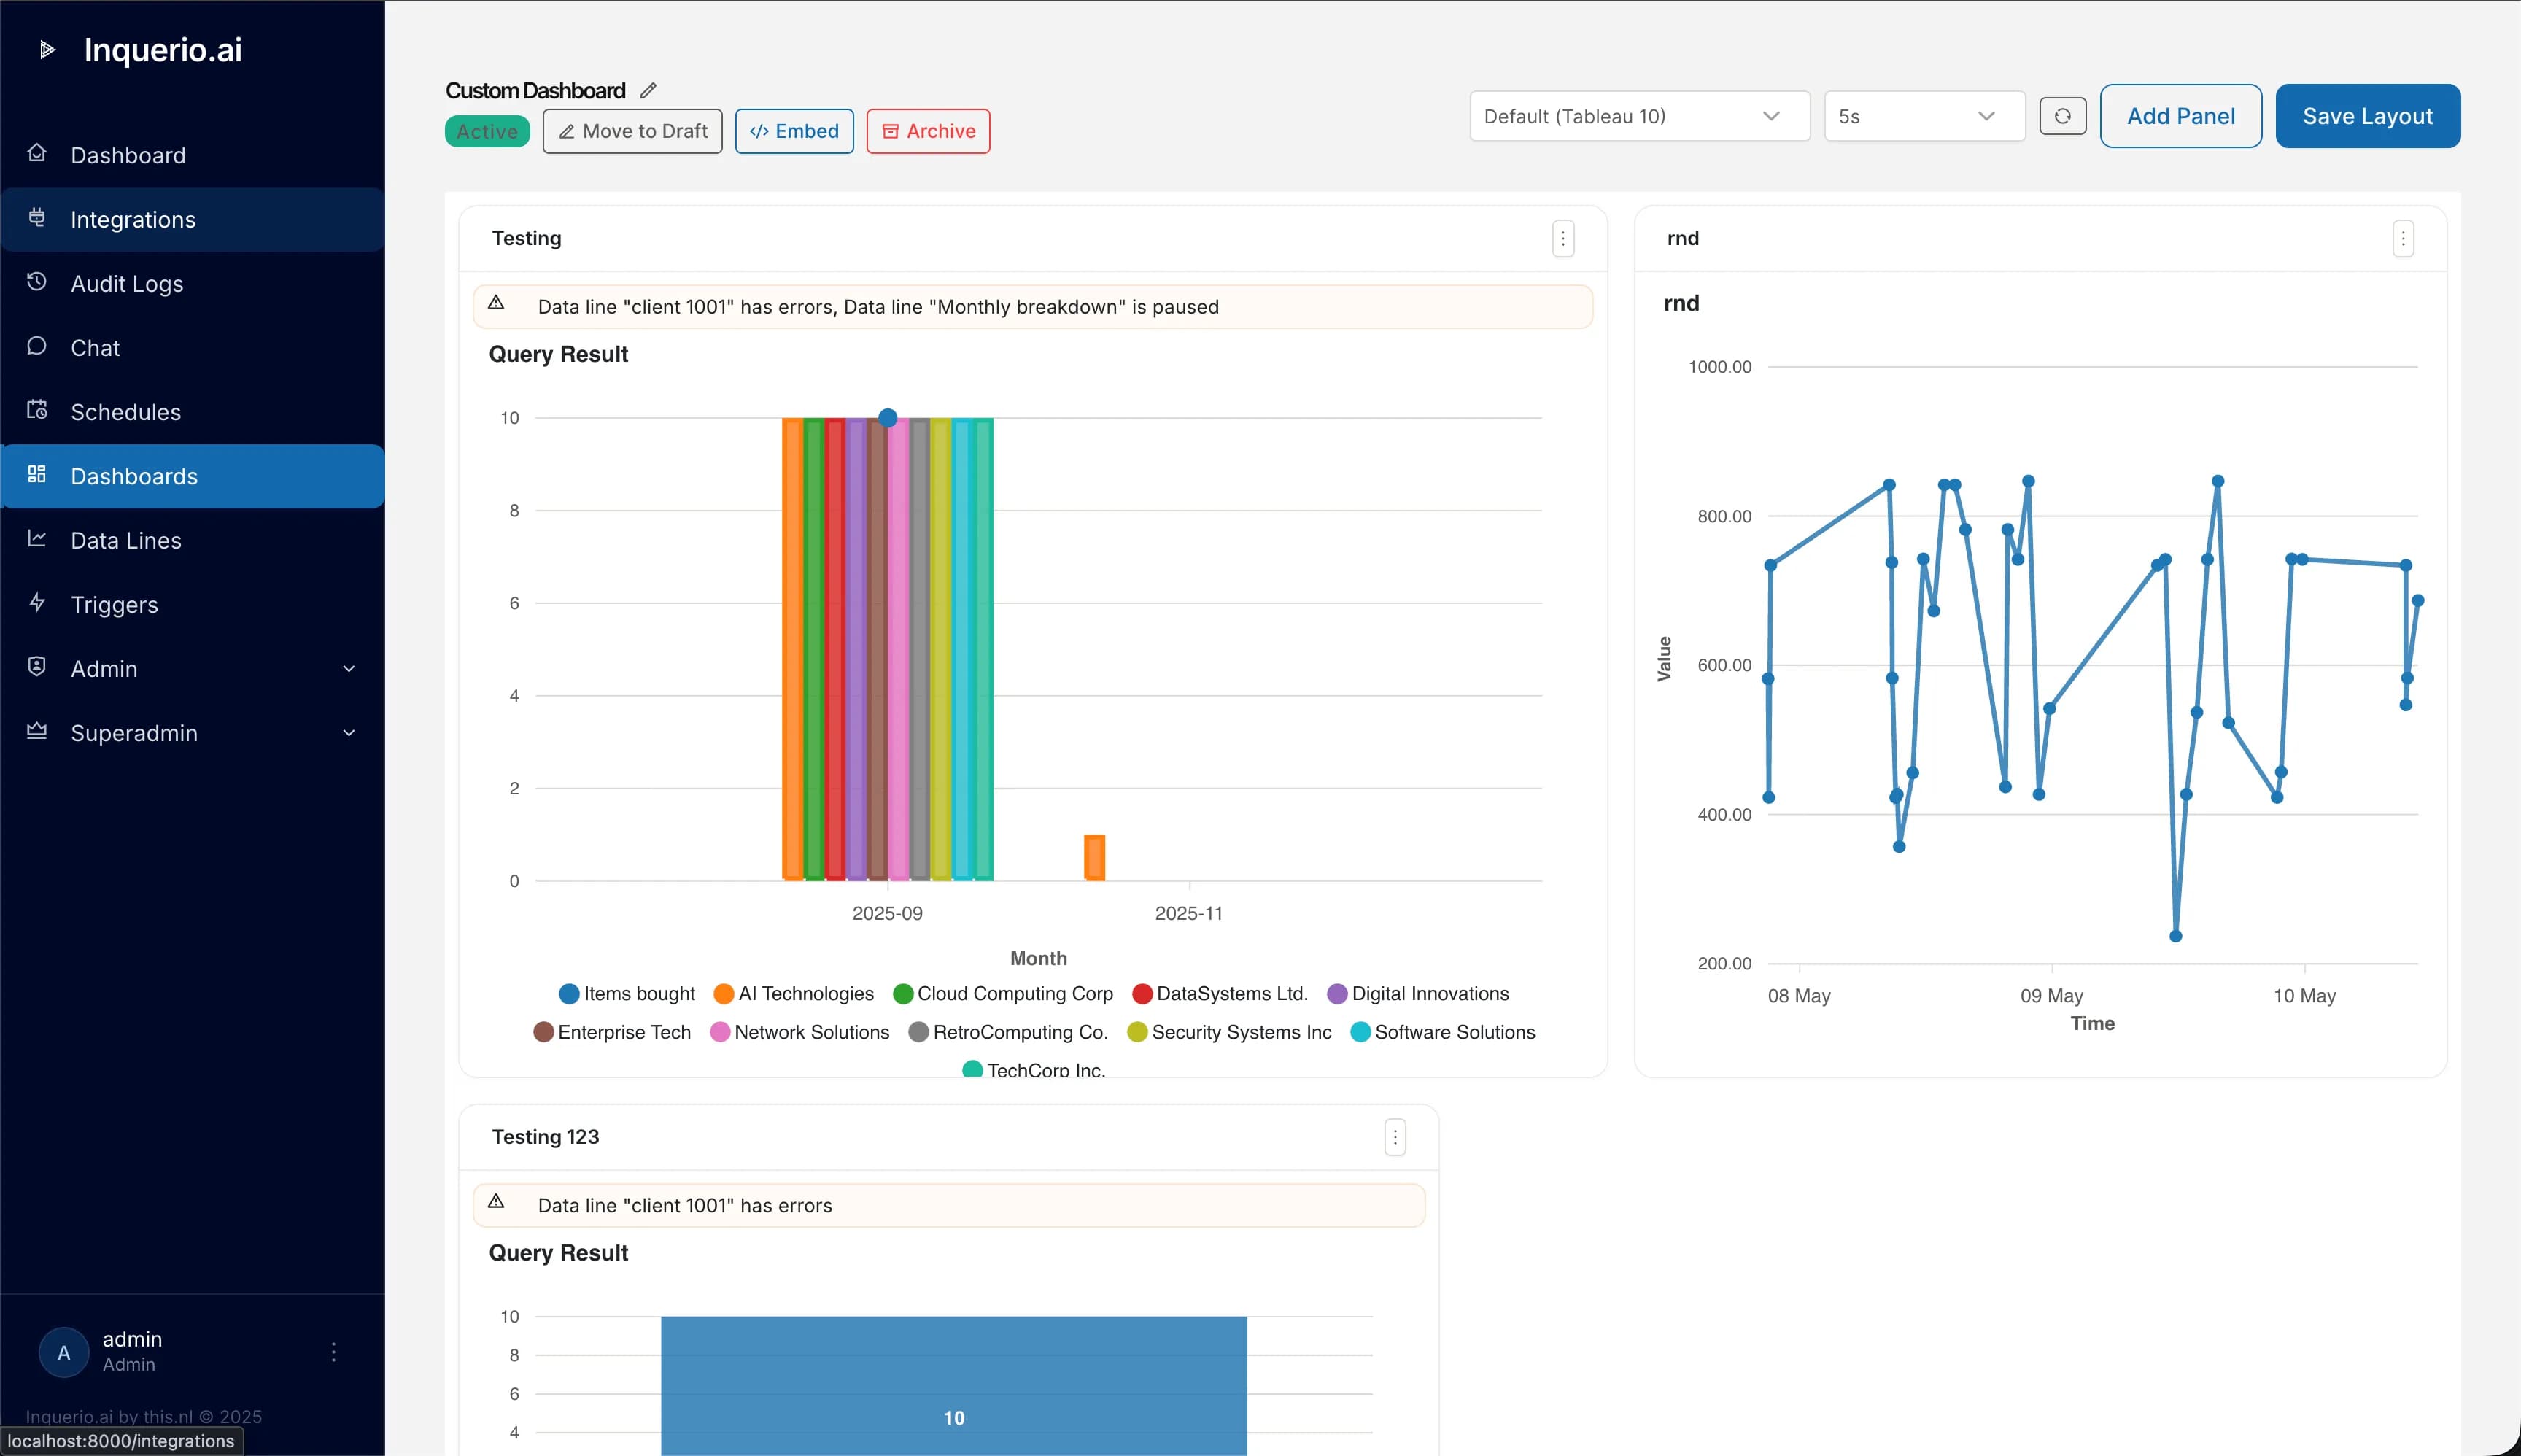
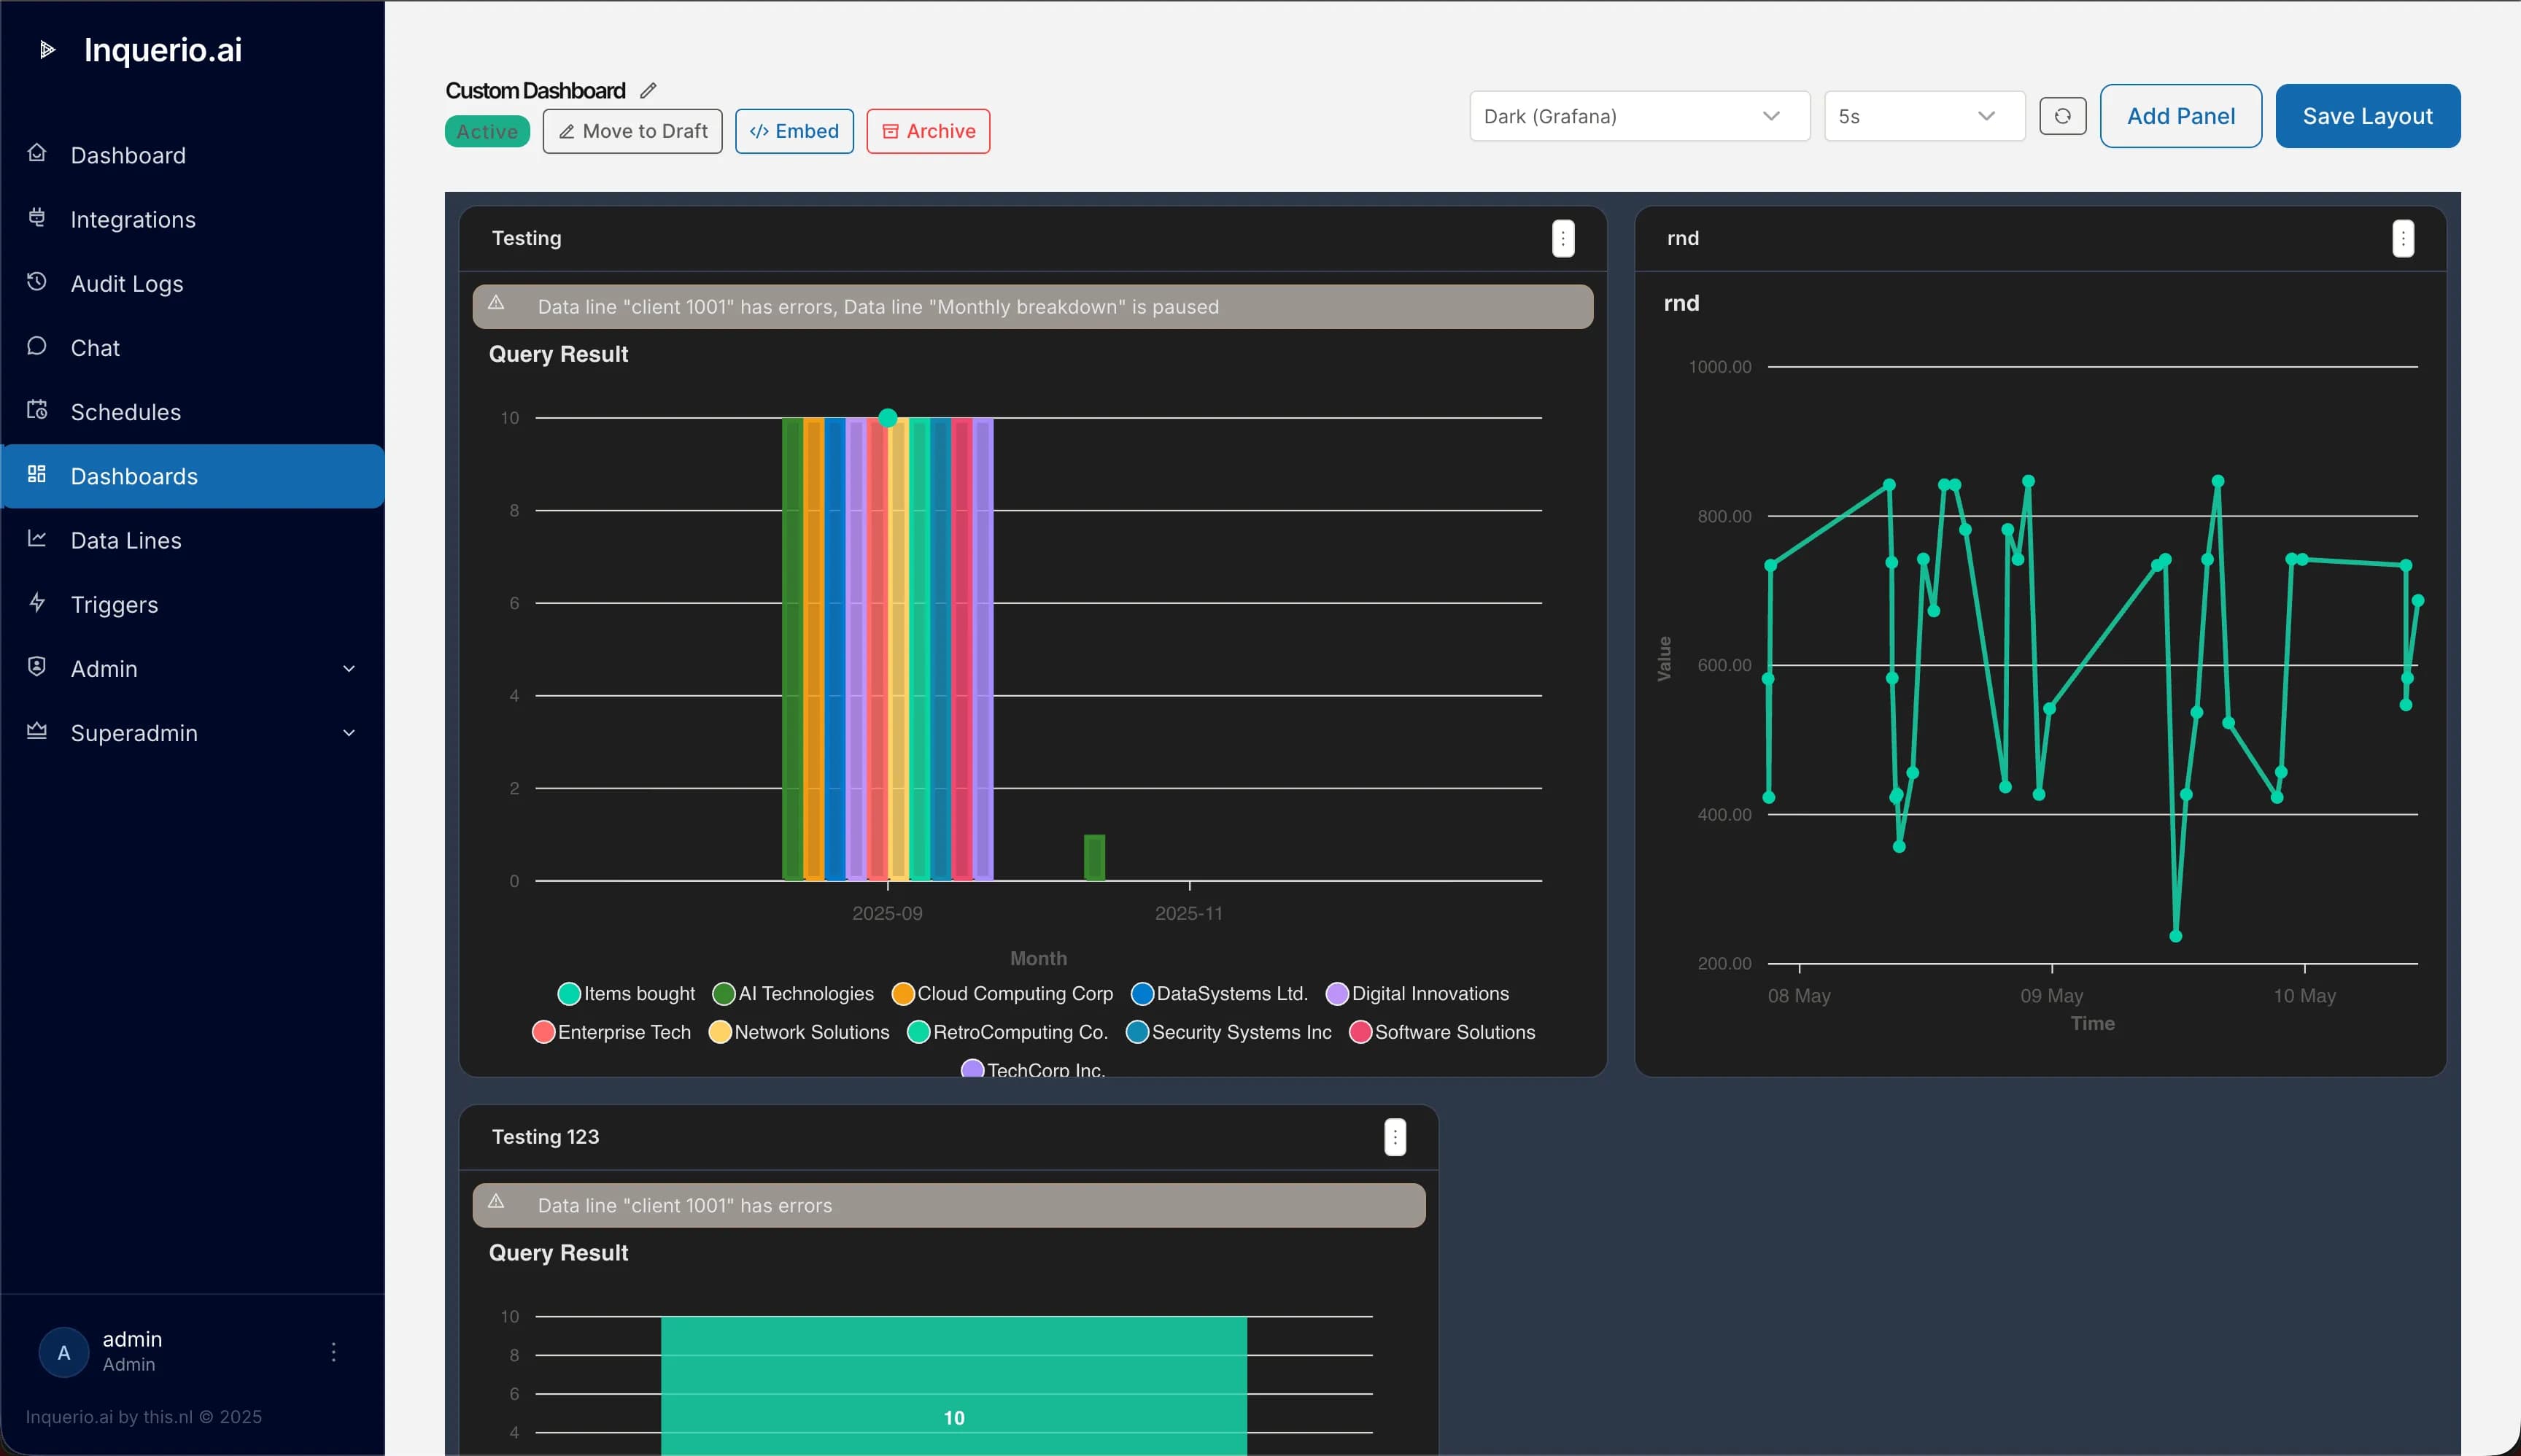
Pick a theme that matches the rest of your stack. The dashboards render the same way in either case.
›Revenue per business unit, last 30 days, day-by-day.
›Yesterday's open tickets by team and priority, with the SLA breach count overlaid.
›The ten oldest unpaid invoices over €5,000, with customer, amount, and days outstanding.
Line, bar, area, pie, donut, gauge, table, stat card, heatmap, scatter, histogram. Pick the one that fits the question, and the dashboard renders it.
Each chart has its own schedule. Hourly, every fifteen minutes, weekday-only, end-of-month. The panel shows when it was last refreshed, so the team knows what they are looking at.
Drop the dashboard into your customer portal, your intranet, or your operations console. iframe for the full experience, tiny JavaScript widget for a single panel.
Roles, groups, and audit. Every embed has its own access scope, and an embedded dashboard never reaches further than its allowed origins.
Per panel, you decide whether each refresh is a fresh question to the model or a re-run of a saved query. Same answer surface for the viewer, different guarantees underneath.
Use this when the question itself can adapt. A new product line appears in the data, a new region opens, and the chart includes it. The cost of an LLM call is paid each refresh, and the answer is validated against the chart's schema before it is stored.
Use this when the shape of the chart should not drift. Inquerio AI saves the exact query that produced the first answer, then reruns that query on the schedule. No LLM call per refresh, and a chart that looks identical from one period to the next.
Whichever mode the panel uses, viewers never see a prompt, an integration name, or a model response. The embed reads from a validated snapshot. There is no LLM call when someone opens the dashboard.
The dashboard does not have to live in Inquerio AI. Drop it into the tools your audience already opens, with the access model that fits the audience.
Two ways in. An iframe gives you the full interactive dashboard with the same look as the rest of Inquerio AI. A small JavaScript widget renders a single panel inside whatever page you already own, with your own styling around it.
Each embed has its own token, its own list of allowed origins, and its own expiry. Public embeds require a manager's approval. Authenticated embeds carry the viewer's identity into the same role and group rules as the rest of Inquerio AI.
The viewer never reaches the integrations, never reaches the language model, never sees a prompt. They see the chart and the moment it is refreshed.
The same scheduling engine that mails the morning report drives the dashboard refresh.
Fire a refresh from any external system the moment something changes.
Roles, groups, allowed origins. The same model as the rest of Inquerio AI.
Pick three questions your team asks every week. We will turn them into a dashboard you can embed wherever your team already works.